
Master Google Analytics 4 with this complete guide to GA4 tracking, events, key events, traffic, SEO, reports, attribution, privacy and best practices.
Google Analytics: The Complete Guide to GA4, Website Traffic, Events, Key Events, Reports, Tracking, SEO & Best Practices
Google Analytics is one of the most widely used tools for understanding what happens after people arrive on a website or interact with an app.
A business may invest heavily in SEO, Google Ads, social media, email marketing, content creation, partnerships, and website development. But without reliable measurement, an important question remains unanswered:
What is actually working?
A website may receive thousands of visitors while generating almost no meaningful business outcomes. Another website may receive much less traffic but attract highly relevant visitors who become subscribers, leads, customers, or repeat buyers.
This is why modern digital analytics should not focus exclusively on traffic.
Businesses need to understand the complete journey:
Acquisition → Engagement → Key Action → Customer → Revenue → Retention
Google Analytics helps businesses investigate this journey.
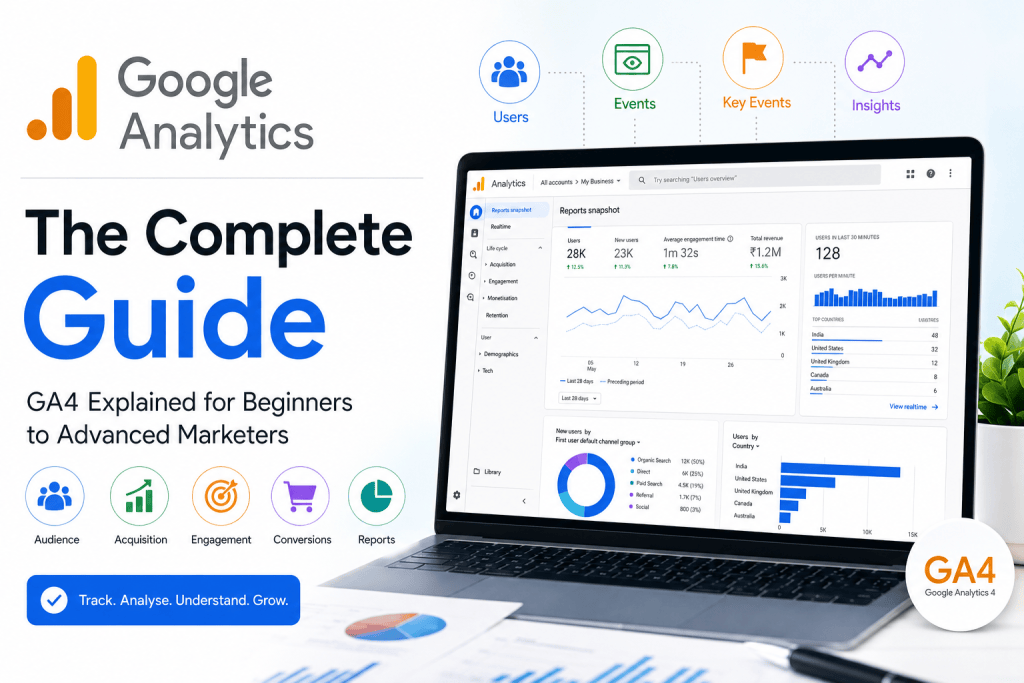
The current generation of Google’s analytics platform is Google Analytics 4, commonly abbreviated as GA4. Unlike the older Universal Analytics model, GA4 is fundamentally event-based and designed to measure interactions across websites and applications.
This comprehensive guide explains Google Analytics from the ground up, including:
- What Google Analytics is
- How GA4 works
- Accounts, properties, and data streams
- Users and sessions
- Events and event parameters
- Key events
- Traffic acquisition
- Engagement
- Landing pages
- UTM parameters
- E-commerce measurement
- Explorations
- Audiences
- Attribution
- Google Ads integration
- Search Console integration
- BigQuery
- Privacy and consent
- Common tracking mistakes
- SEO applications
- Business reporting
- GA4 limitations
- Practical analytics strategy
- Best practices
The objective is not simply to learn where buttons are located inside Google Analytics.
The real objective is to understand how analytics can improve business decisions.
Important: Google Analytics evolves continuously. Reports, terminology, integrations, privacy controls, AI capabilities, interfaces, and configuration options may change. Always verify implementation-specific instructions against current Google documentation.
What Is Google Analytics?
Google Analytics is a digital analytics platform that helps website and app owners collect, measure, analyse, and report information about how users discover and interact with their digital properties.
At a basic level, Google Analytics can help answer questions such as:
- How many people use our website?
- Where do visitors come from?
- Which pages attract the most traffic?
- Which landing pages generate engagement?
- Which marketing campaigns bring visitors?
- Which actions do users perform?
- Which traffic sources generate key events?
- Which products generate revenue?
- Which devices do visitors use?
- Which countries or cities generate traffic?
- Do users return?
- Which campaigns produce valuable customers?
But these are only starting points.
A well-designed analytics implementation can help answer a much more commercially important question:
Which marketing activities contribute to valuable business outcomes?
That distinction separates basic traffic reporting from meaningful marketing analytics.
What Is Google Analytics 4?
Google Analytics 4 is the current generation of Google Analytics.
GA4 was designed around an event-based data model.
This is one of the most important concepts for beginners to understand.
In older analytics systems, measurement often revolved heavily around pageviews and sessions.
GA4 treats interactions as events.
Examples may include:
- Page viewed
- Session started
- User scrolled
- Link clicked
- Video started
- File downloaded
- Product viewed
- Product added to cart
- Checkout started
- Purchase completed
- Form submitted
Additional information can be attached to events through event parameters. Google describes event parameters as information that provides additional context about an interaction.
This creates a flexible measurement model.
Instead of thinking only:
“Which pages did someone visit?”
businesses can increasingly ask:
“What did users actually do?”
Why Google Analytics Matters
Websites generate activity continuously.
Visitors:
- Enter through different channels
- Browse different pages
- Use different devices
- Read articles
- Watch videos
- Click links
- Submit forms
- Purchase products
- Leave
- Return later
Without analytics, much of this activity remains invisible.
A business may believe its Facebook campaign generates customers because it receives many likes.
Another may believe Google Search is its best channel because organic traffic is highest.
Another may focus on a blog post because it receives thousands of pageviews.
But none of those observations necessarily demonstrates commercial value.
Google Analytics can help move decision-making from:
Assumption
toward:
Evidence
That does not mean analytics provides perfect truth.
Measurement has limitations.
But reliable data can dramatically improve marketing decisions compared with intuition alone.
Google Analytics Is Not Just a Traffic Counter
One of the biggest mistakes beginners make is treating Google Analytics as a visitor counter.
They open GA4 and look at:
Users → Sessions → Views
Then they close it.
That wastes much of the platform’s potential.
Traffic volume is only one dimension of performance.
Imagine:
Website A
100,000 monthly visitors
50 leads
5 customers
Website B
20,000 monthly visitors
500 leads
100 customers
Website A has five times more traffic.
Website B generates twenty times more customers.
Which website has better digital performance?
For most commercial organisations, Website B.
This demonstrates a fundamental analytics principle:
Traffic is valuable only in relation to what that traffic accomplishes.
The Google Analytics Measurement Model
A useful simplified model is:
User → Session → Event → Key Event → Business Outcome
Understanding each layer is essential.
What Is a User?
A user represents someone interacting with your website or application according to Google’s measurement methodology.
However, it is important not to interpret the metric too literally.
One human being can sometimes appear as more than one measurable user because they may:
- Use multiple devices
- Use different browsers
- Clear cookies
- Reject certain storage
- Browse anonymously
- Change devices
Conversely, identity features can sometimes help connect interactions where appropriate.
Therefore:
Analytics users are measured identities—not necessarily a perfect count of unique human beings.
This distinction matters whenever analytics numbers are used for business reporting.
What Is a Session?
A session represents a period of user interaction with a website or app.
A user may have multiple sessions.
For example:
Monday:
A visitor discovers your website through Google Search.
Wednesday:
They return directly.
Friday:
They click an email newsletter.
This could represent one person generating several sessions.
Sessions are useful for understanding visits, but they should not automatically be equated with individual people.
What Is an Event?
Events are central to GA4.
An event records an interaction or occurrence.
Examples can include:
page_viewsession_startfirst_visitscrollclickview_itemadd_to_cartbegin_checkoutpurchase
Some events may be collected automatically.
Others may come from enhanced measurement, recommended event implementations, or custom configurations.
The event model allows analytics to represent behaviour more flexibly than a system focused only on pageviews.
What Is an Event Parameter?
An event tells you what happened.
A parameter provides additional context.
Suppose an event records:
purchase
Parameters might provide information about aspects such as:
- Transaction
- Currency
- Value
- Product
- Quantity
Or suppose an event records a click.
Parameters can help identify details associated with that interaction.
Google explains that parameters feed information into dimensions and metrics used in Analytics reports and Explorations.
A useful way to remember this is:
Event = action
Parameter = information about the action
What Are Key Events?
This terminology is particularly important because Google Analytics has evolved.
A key event is an event that represents an action especially important to the success of a business.
Google’s current documentation describes the relationship simply:
Event → Key Event
Any collected event can potentially be marked as a key event when it represents something important to the organisation.
Examples might include:
- Purchase
- Qualified lead submission
- Appointment booking
- Subscription
- Registration
- Important application
- Demo request
The critical word is:
Important.
Do not mark every interaction as a key event simply because the option exists.
Key Events vs Google Ads Conversions
This distinction can confuse beginners.
In Google Analytics, an important action can be designated as a key event.
A Google Ads conversion can then be created based on an Analytics key event where appropriate.
Google states that this approach can help align measurement between Analytics and Google Ads and allows advertisers to use relevant actions for advertising optimisation.
Conceptually:
GA4 Event → GA4 Key Event → Google Ads Conversion
Not every event should become a key event.
And not every key event necessarily needs to become an advertising optimisation target.
What Should You Track?
The answer depends on the business.
There is no universal measurement plan.
For a Blog or Publishing Website
Useful measurements may include:
- Article views
- Engaged sessions
- Scroll engagement
- Newsletter subscriptions
- Outbound clicks
- Downloads
- Returning users
- Traffic source
- Landing pages
For a Lead-Generation Website
Important measurements may include:
- Form submissions
- Qualified enquiries
- Calls
- Consultation bookings
- WhatsApp or communication clicks where appropriately configured
- Lead source
- Landing page
- Qualified lead status
For E-Commerce
Important actions can include:
- Product views
- Add to cart
- Checkout
- Purchase
- Revenue
- Refunds
- Product performance
For SaaS
Measurement might include:
- Registration
- Trial started
- Activation
- Subscription
- Upgrade
- Renewal
- Churn-related behaviour
The principle is:
Track actions that help you understand and improve the business.
Do not collect data merely because it can be collected.
Google Analytics Account Structure
Understanding GA4 architecture prevents many configuration mistakes.
A simplified structure is:
Google Analytics Account → Property → Data Stream
Account
The account is the top organisational level.
Property
A property contains analytics data for a business, website, app, or related digital experience according to the chosen implementation.
Data Stream
A data stream represents a source of incoming data.
Examples include:
- Website
- Android application
- iOS application
A GA4 property can therefore support measurement across different digital environments.
How Google Analytics Collects Website Data
For websites, Google Analytics requires an appropriate measurement implementation.
This may be deployed through:
- Google tag
- Google Tag Manager
- CMS integrations
- Plugins
- Other supported implementations
When properly configured, the measurement system sends interaction information to Google Analytics.
The simplified flow is:
Visitor Interaction → Tag/Event → Google Analytics → Processing → Reports
But implementation quality matters enormously.
A Google Analytics account existing does not mean measurement is correct.
Google Tag vs Google Tag Manager
These are often confused.
Google Tag
The Google tag can send website measurement data to supported Google products.
Google Tag Manager
Google Tag Manager is a tag management system.
It can help businesses deploy and manage tracking configurations without manually editing website code for every individual measurement change.
Google Tag Manager can be used to manage:
- Google Analytics tags
- Advertising tags
- Event tracking
- Conversion tracking
- Other compatible tags
Google Analytics and Google Tag Manager are therefore complementary rather than competing products.
What Is Enhanced Measurement?
GA4 provides enhanced measurement capabilities for web streams.
Depending on configuration, it can automatically measure certain interactions without requiring a separate custom event implementation for each one.
Potential interactions may include areas such as:
- Page views
- Scrolls
- Outbound clicks
- Site search
- Video engagement
- File downloads
However:
Automatic tracking does not eliminate the need for a measurement strategy.
A business should verify what is being collected rather than assuming default settings perfectly represent its goals.
Dimensions and Metrics Explained
Analytics reports combine dimensions and metrics.
Dimension
A dimension describes something.
Examples:
- Country
- Device category
- Page title
- Landing page
- Session source
- Session medium
Metric
A metric measures something numerically.
Examples:
- Users
- Sessions
- Views
- Event count
- Key events
- Revenue
Think of it this way:
Dimension = What?
Metric = How much?
Example:
| Landing Page | Sessions | Key Events |
|---|---|---|
| /seo-guide/ | 5,000 | 150 |
| /google-ads-guide/ | 2,500 | 200 |
“Landing Page” is a dimension.
“Sessions” and “Key Events” are metrics.
Users, Sessions and Views: Understanding the Difference
These three metrics should not be used interchangeably.
Users
Measured users interacting with the digital property.
Sessions
Periods of interaction.
Views
Views of pages or screens.
One user can generate:
Multiple sessions
and one session can generate:
Multiple views
For example:
1 user
3 sessions
15 pageviews
These numbers describe different aspects of behaviour.
Active Users
GA4 places substantial emphasis on active users.
Depending on the report and metric, user counts can therefore differ from expectations formed using older analytics systems.
When comparing numbers, always verify which user metric is being displayed.
Do not assume every “users” number represents exactly the same calculation.
Engagement in GA4
GA4 uses engagement-oriented measurements to help businesses understand whether visitors meaningfully interact with digital experiences.
This is important because traffic alone says little about quality.
Suppose two sources each generate 10,000 sessions.
Source A
Visitors leave almost immediately.
Source B
Visitors read multiple pages, interact with important content, and become leads.
Raw traffic suggests equality.
Engagement and key-event data reveal the real difference.
Engaged Sessions
An engaged session is designed to represent a session meeting Google’s engagement criteria.
This makes it more useful than simply knowing that a session occurred.
Businesses can use engagement data to compare:
- Channels
- Landing pages
- Content
- Devices
- Campaigns
- Audiences
But engagement should still be interpreted in context.
A user who finds a phone number immediately and calls may generate enormous business value despite limited on-site engagement.
Engagement Rate
Engagement rate represents the proportion of sessions considered engaged.
It can help identify:
- Strong landing pages
- Weak traffic sources
- Relevant content
- Potential UX issues
But there is no universal “good engagement rate.”
Context matters.
A news article, product page, contact page, and SaaS dashboard have very different user behaviours.
Bounce Rate
Bounce rate still exists in GA4, but its interpretation differs from older Universal Analytics thinking.
It is essentially the inverse of engagement rate.
If engagement rate is 65%, bounce rate is 35%.
This makes the metric more aligned with GA4’s engagement model.
However, avoid obsessing over bounce rate.
A low bounce rate is not automatically profitable.
A high bounce rate is not automatically disastrous.
Always connect behaviour to the page’s intended purpose.
Acquisition Reports
One of the most important jobs of analytics is explaining:
Where did users come from?
GA4 provides acquisition reporting that can help answer this question.
But there is an important distinction between user acquisition and traffic acquisition.
User Acquisition
User acquisition focuses on how users were first acquired.
This is useful for understanding the channel that initially introduced a user to the website or app.
Traffic Acquisition
Traffic acquisition focuses on sessions.
This is useful for understanding what generated particular visits.
Consider:
Monday:
A user first discovers your site through organic Google Search.
Friday:
They return through an email newsletter.
User acquisition may still associate the user with their original acquisition source.
Traffic acquisition can describe the later email-driven session.
Both perspectives are valuable.
They answer different questions.
Understanding Source, Medium and Campaign
These concepts are essential for digital marketing analysis.
Source
Where the traffic came from.
Examples might include:
- newsletter
- partner website
Medium
The broad mechanism or type of traffic.
Examples might include:
- organic
- cpc
- referral
Campaign
A campaign identifier used to distinguish marketing initiatives.
For example:
Source: newsletter
Medium: email
Campaign: august_seo_guide
This structure helps businesses understand marketing performance more accurately.
What Are UTM Parameters?
UTM parameters are tracking parameters added to URLs to identify marketing traffic.
Common parameters include:
utm_sourceutm_mediumutm_campaignutm_termutm_content
Suppose a business distributes the same landing page through:
- Newsletter
- Partner campaign
Without consistent campaign tagging, attribution may become confusing.
UTM parameters can help distinguish those sources.
UTM Naming Best Practices
Poor UTM governance creates messy analytics.
For example:
- FB
- facebook.com
- Facebook_Social
may unintentionally fragment reporting.
Create naming conventions before launching large campaigns.
A simple convention could define:
Source: platform or publisher
Medium: marketing channel
Campaign: campaign identifier
Content: creative variation
Consistency matters more than cleverness.
Do Not Add UTMs to Internal Links
This is an important mistake to avoid.
UTM parameters are primarily designed for campaign attribution from external traffic sources.
Adding them to internal website navigation can overwrite or distort acquisition information.
For internal analysis, use appropriate event tracking or page-level measurement instead.
Understanding Default Channel Groups
Google Analytics can categorise traffic into channel groupings.
Examples may include categories such as:
- Organic Search
- Paid Search
- Direct
- Referral
- Organic Social
- Paid Social
- Display
Channel grouping helps simplify complex source/medium data.
However, marketers should still inspect underlying source and medium information when troubleshooting attribution.
What Is Direct Traffic?
Direct traffic is often misunderstood as:
“People typed the website address directly.”
That can happen.
But Direct may also include traffic for which Analytics cannot determine a more specific source.
Therefore, unexpectedly high Direct traffic can sometimes indicate attribution or tagging problems.
Do not automatically interpret all Direct traffic as brand loyalty.
Referral Traffic
Referral traffic generally represents users arriving via links on other websites.
Referral analysis can help identify:
- Backlink traffic
- Partnerships
- Directory traffic
- Media mentions
- Guest posts
- Affiliate traffic
But referral data also needs monitoring for unwanted or misleading referrals.
Organic Search Traffic
Organic Search represents unpaid traffic attributed to search engines according to Analytics’ channel classification.
For SEO teams, this is one of the most important channel categories.
However, GA4 should not replace Google Search Console.
The two platforms answer different questions.
Google Analytics vs Google Search Console
This distinction is essential.
Google Search Console
Primarily helps understand Google Search performance before and around the search click.
It can provide information about:
- Search queries
- Search impressions
- Search clicks
- CTR
- Average position
- Indexing
- Crawling
- Search appearance
Google Analytics
Primarily helps understand what happens on the website or app after measurable interactions occur.
It can provide information about:
- Users
- Sessions
- Engagement
- Events
- Key events
- Revenue
- Landing pages
- Acquisition
A useful model is:
Search Console = Search visibility and clicks
Google Analytics = On-site behaviour and outcomes
Used together, they provide a much stronger SEO measurement system.
Google Analytics for SEO
SEO success should not be measured solely by rankings.
A better framework is:
Visibility → Organic Traffic → Engagement → Key Events → Revenue/Business Value
GA4 helps measure the later stages.
For example, SEO teams can investigate:
- Organic landing pages
- Engagement from organic traffic
- Key events from organic users
- Revenue from organic traffic
- Returning organic users
- Geographic performance
- Device behaviour
This helps answer a much better question than:
“Which pages get traffic?”
The better question is:
“Which organic landing pages generate valuable users and business outcomes?”
Landing Page Analysis
Landing-page reporting is one of the most useful areas for SEO, advertising, and content teams.
A landing page is the first page associated with a session.
Suppose:
Article A
50,000 organic sessions
50 key events
Article B
10,000 organic sessions
500 key events
Article A has five times more traffic.
Article B produces ten times more key events.
If those key events represent meaningful business actions, Article B may be far more commercially valuable.
This is why traffic volume alone should never determine content priorities.
Content Performance Analysis
Publishers can use GA4 to analyse content through multiple dimensions.
Useful questions include:
- Which articles attract new users?
- Which articles generate engaged sessions?
- Which pages lead to newsletter subscriptions?
- Which articles contribute to enquiries?
- Which content receives repeat visits?
- Which content attracts international audiences?
- Which pages send users deeper into the site?
A high-value content strategy connects:
Search Demand + Content Quality + Engagement + Business Outcomes
Google Analytics and Google Ads
Connecting Google Analytics and Google Ads can create a more integrated measurement environment.
Where appropriately configured, the connection can help advertisers:
- Analyse advertising traffic
- Use Analytics audiences
- Connect important actions with advertising measurement
- Understand post-click behaviour
- Improve campaign evaluation
Google Analytics key events can also be used to create conversions in Google Ads.
However, linking the platforms does not automatically guarantee correct attribution or campaign optimisation.
Tracking quality still matters.
Google Analytics and E-Commerce
GA4 supports e-commerce measurement.
An e-commerce implementation can measure important shopping interactions such as:
Product View → Add to Cart → Checkout → Purchase
This allows businesses to analyse where users leave the purchase journey.
Suppose:
10,000 product views
2,000 add-to-cart actions
1,000 checkout starts
200 purchases
This immediately creates questions:
Why did 80% of product viewers not add an item?
Why did 50% of cart users not begin checkout?
Why did 80% of checkout starters not purchase?
Analytics does not automatically provide every answer.
But it reveals where investigation should begin.
Revenue vs Profit
GA4 can help measure revenue.
But businesses must avoid confusing revenue with profit.
Suppose:
Product A
Revenue: ₹10,00,000
Gross margin: 10%
Product B
Revenue: ₹7,00,000
Gross margin: 40%
Product B may contribute considerably more gross profit.
Therefore, analytics should eventually be connected with broader business data where sophisticated profitability analysis is required.
Funnel Analysis
Funnels represent sequences of actions users take toward a goal.
Example:
Landing Page → Product View → Add to Cart → Checkout → Purchase
For lead generation:
Landing Page → Service Page → Form Start → Form Submit → Qualified Lead
Funnel analysis helps identify where users drop out.
Suppose:
5,000 landing-page visits
2,500 service-page views
500 form starts
50 submissions
The biggest opportunity may be between service-page viewing and form initiation.
Instead of blindly increasing advertising spend, the business could investigate:
- Offer clarity
- Trust
- Form visibility
- Page speed
- Pricing
- CTA strength
- Mobile usability
Analytics can therefore guide conversion optimisation.
Explorations in GA4
Standard reports are useful for routine monitoring.
Explorations provide more flexible analytical capabilities.
Google Analytics supports advanced analysis techniques that allow users to investigate data beyond standard reports.
Explorations can help analyse:
- Funnels
- User paths
- Segments
- Cohorts
- User lifetime
- Detailed combinations of dimensions and metrics
This is where GA4 becomes significantly more powerful for analysts.
Free-Form Exploration
Free-form exploration allows analysts to combine dimensions, metrics, filters, segments, and visualisations more flexibly.
Potential questions include:
- Which landing pages generate purchases from mobile users?
- Which channels generate returning customers?
- Which countries produce the highest-value users?
- Which campaigns generate key events?
Instead of relying exclusively on predefined reports, businesses can investigate their own questions.
Funnel Exploration
Funnel exploration can help visualise progression through defined steps.
For example:
Homepage → Service Page → Contact Page → Lead
or:
Product → Cart → Checkout → Purchase
This can reveal bottlenecks in the customer journey.
Path Exploration
Path exploration helps investigate sequences of user behaviour.
You might ask:
What do visitors do after reading our SEO guide?
They may:
- Leave
- Read another article
- Visit a service page
- Visit About
- Submit a form
Understanding these paths can inform:
- Internal linking
- Navigation
- Calls to action
- Content strategy
Segment Analysis
Averages can hide important differences.
Suppose the overall conversion rate is 3%.
But:
Desktop = 6%
Mobile = 1%
The average hides a serious mobile problem.
Segmentation can help compare:
- Device
- Country
- Channel
- Campaign
- New vs returning users
- Landing page
- Customer group
One of the most important analytical principles is:
Never rely on averages when meaningful segments behave differently.
Audiences
GA4 audiences allow businesses to group users according to relevant conditions.
Potential examples include:
- Product viewers
- Purchasers
- Returning users
- High-value customers
- Cart abandoners
- Users interested in specific content
Audiences can support:
- Analysis
- Personalisation workflows
- Advertising and remarketing where permitted
Audience use must comply with applicable privacy laws and Google policies.
Attribution Explained
Marketing attribution attempts to assign credit for outcomes across customer touchpoints.
Imagine:
Day 1: User discovers the business through organic Google Search.
Day 5: They watch a YouTube video.
Day 10: They click a paid advertisement.
Day 15: They return directly and purchase.
Which channel deserves credit?
There is no philosophically perfect answer.
This is the attribution problem.
Why Attribution Matters
If a business assigns 100% of the value to the final interaction, it may undervalue channels that introduced or educated the customer.
If it overvalues awareness channels, it may invest in activity that does not contribute enough to commercial outcomes.
Attribution models attempt to provide structured approaches to distributing credit.
Google Analytics includes advertising and attribution reporting designed to help analyse touchpoints associated with key events.
Attribution Is Not Perfect Truth
Attribution is a model.
It is not a complete reconstruction of human decision-making.
Customers may also be influenced by:
- Word of mouth
- Offline advertising
- Friends
- Reviews
- Podcasts
- Brand familiarity
- Sales conversations
Some of these influences may never appear in Analytics.
Use attribution as decision support—not unquestionable truth.
Data-Driven Attribution
Google’s modern analytics and advertising systems increasingly use data-driven approaches to allocate credit based on observed patterns.
This can be more sophisticated than rigid rules such as:
Give 100% credit to the final click.
But sophisticated modeling does not eliminate data limitations.
Privacy restrictions, cross-device behaviour, consent, and unobserved interactions can still affect measurement.
Modeled Key Events
Modern digital analytics sometimes operates with incomplete observability.
Google uses modeling in certain circumstances to estimate key events that cannot be directly observed, such as situations involving privacy or technical limitations.
Google states that modeled key events are only included when its systems have sufficient confidence in the quality of the estimate.
This is an important reason why analytics numbers should not always be interpreted as a perfect transaction ledger.
Privacy and Google Analytics
Analytics must be implemented responsibly.
Businesses should consider:
- Applicable privacy law
- Cookie requirements
- Consent
- Data minimisation
- Retention
- Access controls
- User deletion requests
- Advertising features
- Sensitive information
Do not collect personally identifiable or prohibited information simply because a tracking system technically allows custom data.
Measurement strategy should begin with:
What do we genuinely need to understand?
not:
How much information can we collect?
Consent Mode
Consent mode provides mechanisms for communicating user consent choices to Google tags.
Where users do not consent to certain storage, measurement behaviour can adapt accordingly.
Google’s systems may use modeling in eligible circumstances to help address measurement gaps without directly observing all interactions.
Consent mode should not be confused with a complete consent-management solution or legal compliance guarantee.
Businesses remain responsible for understanding applicable requirements.
Data Retention
Data retention deserves attention during GA4 configuration.
For standard Google Analytics properties, user-level and event-level data retention options include 2 months or 14 months. Analytics 360 offers additional longer options in supported circumstances.
Importantly, Google explains that these retention settings primarily affect certain user-level/event-level data used in areas such as Explorations rather than simply deleting all aggregated standard reporting after the selected period.
For businesses intending to conduct long-term exploratory analysis, reviewing retention settings early is important.
Google Analytics Standard vs Analytics 360
Google offers a standard version and the enterprise-oriented Analytics 360.
Many small and medium-sized businesses can operate effectively using the standard product.
Analytics 360 provides higher limits and enterprise capabilities.
For example, Google’s current limits show differences in areas such as:
- Data retention
- Audiences
- Custom dimensions and metrics
- Exploration sampling
- BigQuery exports
- Key-event limits
Standard GA4 properties currently support up to 14 months of applicable user/event retention, while 360 provides longer options up to 50 months in applicable cases.
What Is BigQuery?
BigQuery is Google’s cloud data warehouse.
GA4 can export raw event data to BigQuery, enabling much more advanced analysis.
Google describes BigQuery export as a way to access raw Analytics event data and query it using SQL-like syntax.
This can be valuable for organisations that need:
- Custom analytics
- Advanced attribution
- Data warehousing
- Long-term data analysis
- Business intelligence
- Joining analytics with CRM data
- Profit analysis
- Customer modeling
Why BigQuery Matters
The standard GA4 interface is designed to make common reporting accessible.
BigQuery provides greater analytical flexibility.
A sophisticated business might combine:
GA4 events + CRM + Advertising cost + Product margins + Customer data
to answer questions that standard reports cannot easily answer.
For example:
Which acquisition channel produces customers with the highest 12-month gross profit?
That is a much more advanced question than:
Which channel produced the most sessions?
GA4 and BigQuery Numbers May Differ
Businesses should not assume the GA4 interface and BigQuery will always display identical numbers.
Google explains that differences can occur because BigQuery contains raw event/user-level export data while the GA4 reporting interface can apply additional processing, modeling, identity logic, and other reporting behaviours.
Google notes that some discrepancy between event counts can be expected when comparing the two systems.
Therefore:
Different numbers do not automatically mean one system is broken.
Investigate methodology before drawing conclusions.
Sampling
Sampling means analysing a subset of data rather than every available event when certain query limits are exceeded.
GA4’s standard reporting surfaces and Explorations do not always behave identically in this respect.
Google explains that data may be sampled in certain analytical situations and that larger datasets can encounter reporting limits.
Standard-property Explorations currently have a 10-million-event sampling limit per query under Google’s documented configuration limits.
Large organisations should therefore understand the data-quality indicator before interpreting complex analyses.
The “(Other)” Row
Another analytics issue occurs when high-cardinality dimensions generate more distinct values than reporting tables can display efficiently.
Less common values may be grouped into an “(other)” row.
Google explains that this occurs when table row limits are exceeded.
This can happen with poorly designed custom dimensions or dimensions containing too many unique values.
Measurement architecture therefore matters.
Data Thresholding
GA4 may withhold certain information in reports or Explorations to protect user privacy when there is insufficient aggregated data.
Google calls this data thresholding.
It can apply in contexts involving demographics, audiences, or certain search-query information.
When data appears unexpectedly missing, check the data-quality indicator before assuming tracking is broken.
Real-Time Reports
Real-time reporting can help verify recent activity.
This is useful when:
- Testing a new implementation
- Publishing a new campaign
- Checking active traffic
- Verifying events
- Troubleshooting
However, real-time reports should not become the primary way a business evaluates marketing success.
Watching visitor counts rise and fall can feel productive while providing little strategic insight.
Use real-time reporting primarily for operational monitoring and testing.
Debugging Analytics
A measurement implementation should be tested before business decisions depend on it.
Check whether:
- Page views fire correctly
- Events fire once rather than multiple times
- Key events represent real actions
- E-commerce values are correct
- Internal traffic is handled appropriately
- Referral attribution makes sense
- Campaign parameters work
- Cross-domain journeys work where needed
Bad analytics is sometimes worse than no analytics because it creates false confidence.
Duplicate Tracking
A common technical mistake is installing GA4 multiple times.
For example:
- Theme integration
- WordPress plugin
- Google Tag Manager
- Manual code
all send the same event.
The business may then record inflated:
- Pageviews
- Events
- Key events
Before adding another Analytics integration, determine what is already installed.
Internal Traffic
Employees, developers, agencies, and administrators may visit a website frequently.
For small websites, internal visits can materially distort data.
Imagine:
Real users = 1,000 sessions
Internal team = 500 sessions
A third of recorded sessions may not represent customers.
Businesses should consider appropriate internal-traffic handling while ensuring that filters and exclusions are configured carefully.
Cross-Domain Measurement
Some customer journeys involve multiple domains.
Example:
Main Website → Booking Domain → Payment Domain
Without proper configuration, Analytics may interpret parts of the same customer journey incorrectly.
Cross-domain measurement can help maintain continuity where technically and legally appropriate.
This is especially important for:
- SaaS
- Booking systems
- Payment flows
- Multi-domain businesses
Referral Exclusions and Unwanted Referrals
Payment processors, third-party booking systems, and related services can sometimes appear as referral sources if implementations are not configured appropriately.
This can distort acquisition reporting.
Always review referral traffic for unexpected sources.
Common Google Analytics Mistakes
1. Installing Analytics and Never Checking It
Measurement without analysis creates little value.
2. Tracking Only Pageviews
Modern analytics should measure meaningful interactions and outcomes.
3. Marking Too Many Events as Key Events
If everything is important, nothing is important.
4. Tracking Form Clicks Instead of Successful Submissions
A button click does not necessarily mean a form was successfully submitted.
5. Ignoring Duplicate Tags
Duplicate implementations can inflate data.
6. Ignoring UTM Governance
Inconsistent naming creates fragmented campaign reports.
7. Adding UTMs to Internal Links
This can distort attribution.
8. Treating Users as Exact Human Counts
Measurement identities have technical limitations.
9. Treating Direct Traffic as Only Typed URLs
Direct traffic can also represent missing attribution information.
10. Assuming Analytics and Search Console Must Match Exactly
They measure different systems using different methodologies.
11. Assuming Google Ads and GA4 Must Always Match Exactly
Attribution, reporting logic, timing, and conversion configuration can differ.
12. Ignoring Privacy
Analytics implementation must respect applicable legal and platform requirements.
13. Focusing on Vanity Metrics
More traffic does not automatically mean better business performance.
14. Never Reviewing Data Retention
Important historical exploratory data may become unavailable according to configured retention.
15. Making Decisions From Tiny Samples
Ten sessions do not necessarily establish a meaningful trend.
Vanity Metrics vs Actionable Metrics
A vanity metric looks impressive but may not help make decisions.
Examples can include:
- Total pageviews
- Total users
- Raw impressions
These are not useless.
But they become valuable when connected to outcomes.
Instead of:
“Traffic increased 30%.”
ask:
“Did qualified traffic, key events, customers, and revenue also increase?”
A better measurement chain is:
Traffic → Engagement → Key Event → Customer → Revenue → Profit
Google Analytics for Small Businesses
Small businesses do not need hundreds of reports.
They need answers to a few important questions:
- Where are customers coming from?
- Which landing pages generate enquiries?
- Which campaigns produce qualified leads?
- Which devices create problems?
- Which marketing activities generate revenue?
- What should we improve next?
A small-business analytics dashboard can therefore focus on:
- Users
- Sessions
- Channel
- Landing page
- Key events
- Key-event rate
- Qualified leads
- Revenue
- Customer acquisition source
Simplicity is often better than collecting dozens of metrics nobody uses.
Google Analytics for Bloggers and Publishers
Publishers should go beyond pageviews.
Useful metrics can include:
- Organic acquisition
- Engaged sessions
- Engagement time
- Returning users
- Newsletter subscriptions
- Outbound clicks
- Downloads
- Content-assisted key events
- Traffic by country
- Traffic by device
- Landing-page performance
A successful article should not necessarily be defined as:
“The article with the most views.”
A more useful definition may be:
“The article that attracts relevant users and contributes most effectively to the website’s goals.”
Google Analytics for Lead Generation
Lead-generation businesses should connect Analytics with lead quality.
Basic measurement:
Form Submission
Better measurement:
Qualified Lead
Advanced measurement:
Lead → Sales Opportunity → Customer → Revenue
Suppose:
Campaign A = 500 leads
Campaign B = 100 leads
Campaign A appears superior.
But:
Campaign A = 5 customers
Campaign B = 30 customers
Campaign B is dramatically better.
This is why downstream CRM data can become essential.
Google Analytics for E-Commerce Businesses
E-commerce analytics should connect:
Traffic → Product → Cart → Checkout → Purchase → Revenue
Useful questions include:
- Which channels generate purchases?
- Which products convert?
- Which landing pages generate revenue?
- Where do users abandon checkout?
- Which devices underperform?
- Which campaigns generate high-value customers?
Advanced businesses should eventually incorporate:
- Gross margin
- Returns
- Customer lifetime value
- Repeat purchases
because revenue alone does not equal profitability.
Google Analytics for B2B
B2B customer journeys are often long.
A visitor may:
- Read an article.
- Return a week later.
- Download a resource.
- Attend a webinar.
- Request a consultation.
- Enter the CRM.
- Become a customer months later.
GA4 alone may not capture the entire commercial story.
B2B analytics works best when integrated conceptually or technically with:
- CRM
- Sales pipeline
- Marketing automation
- Advertising platforms
- Revenue data
The objective is:
Marketing Source → Lead → Opportunity → Customer → Revenue
A Practical GA4 Measurement Strategy
A strong implementation begins with business questions, not tags.
Step 1: Define Business Objectives
Examples:
- Generate qualified leads
- Sell products
- Grow subscriptions
- Increase bookings
- Increase app activation
Step 2: Define Important User Actions
Identify actions connected to those objectives.
Examples:
- Lead submitted
- Purchase
- Subscription
- Booking
Step 3: Build an Event Plan
Determine which events are necessary to understand the customer journey.
Avoid unnecessary tracking.
Step 4: Identify Key Events
Mark only strategically important events.
Step 5: Implement Tracking
Use an appropriate implementation method.
Step 6: Validate Data
Test events and parameters before relying on reports.
Step 7: Establish Campaign Naming Standards
Create consistent UTM rules.
Step 8: Connect Relevant Products
Where appropriate, integrate platforms such as Google Ads, Search Console, or BigQuery.
Step 9: Create Useful Reports
Build reports around actual business questions.
Step 10: Review Regularly
Analytics is not a one-time installation.
Weekly Analytics Review
A weekly review might examine:
- Traffic trend
- Channel performance
- Landing pages
- Key events
- Conversion changes
- Campaign anomalies
- Technical measurement problems
The purpose is operational awareness.
Monthly Analytics Review
A monthly review can go deeper.
Analyse:
- Acquisition trends
- SEO landing pages
- Paid campaign quality
- Content performance
- Key-event trends
- Revenue
- Device differences
- Geographic differences
- Funnel performance
Ask:
What changed, why did it change, and what should we do next?
Quarterly Analytics Review
Quarterly analysis should become more strategic.
Review:
- Customer acquisition trends
- Channel contribution
- Content ROI
- Marketing efficiency
- Customer quality
- Long-term behaviour
- Measurement gaps
This prevents analytics from becoming a dashboard-watching exercise.
The Analytics Question Framework
Whenever you open GA4, begin with a question.
Weak approach:
“Let’s look at Analytics.”
Strong approach:
“Why did qualified leads decline this month despite traffic increasing?”
Then investigate:
- Which channels changed?
- Which landing pages changed?
- Did mobile performance decline?
- Did key-event tracking change?
- Did traffic geography change?
- Did paid traffic quality change?
- Did conversion rate decline?
Analytics becomes valuable when it supports structured investigation.
Google Analytics Benefits
The major advantages include:
- Website and app measurement
- Event-based tracking
- Traffic acquisition analysis
- Engagement measurement
- Key-event tracking
- E-commerce measurement
- Audience analysis
- Advertising integration
- Search Console integration
- Explorations
- Attribution analysis
- BigQuery export
- Custom dimensions and metrics
- Cross-platform measurement capabilities
For many businesses, the standard product provides substantial analytics capability without requiring an enterprise analytics licence.
Google Analytics Drawbacks and Limitations
Google Analytics is powerful, but it has important limitations.
Data Is Not Perfect
Cookies, consent, devices, blockers, technical issues, and privacy controls can affect measurement.
Implementation Can Be Complex
Advanced event tracking requires planning and technical expertise.
Attribution Is Imperfect
Not every influence on a customer decision can be measured.
Privacy Requirements Matter
Tracking must be implemented responsibly.
Reporting Can Be Confusing for Beginners
GA4 has a significant learning curve.
Sampling and Thresholding Can Affect Analysis
Some advanced analyses can encounter data limits.
Revenue Is Not Profit
Business economics often exist outside GA4.
Analytics Does Not Explain Everything
It can tell you:
What happened?
It may help identify:
Where?
But it does not always tell you:
Why?
Qualitative research may still be needed.
Google Analytics vs Server Logs
Server logs and Google Analytics measure activity differently.
Server logs can record server requests, including traffic that may never execute browser-based Analytics tracking.
GA4 focuses on user interaction measurement according to its implementation.
Therefore, the numbers should not necessarily match.
Different measurement systems answer different questions.
Google Analytics vs CRM
Google Analytics focuses heavily on digital interactions and acquisition.
A CRM focuses more on identifiable business relationships, leads, opportunities, and customers according to the organisation’s CRM implementation.
A powerful business intelligence system can connect:
Analytics + CRM + Advertising + Revenue
rather than expecting one platform to perform every function.
How to Measure SEO ROI With Google Analytics
A simplified framework is:
Organic Traffic → Organic Key Events → Customers → Revenue
For a lead-generation business:
Organic sessions = 20,000
Leads = 500
Qualified leads = 100
Customers = 20
Average gross profit/customer = ₹20,000
Estimated gross profit contribution:
20 × ₹20,000 = ₹4,00,000
This is far more commercially meaningful than reporting:
“Organic traffic increased by 10%.”
SEO measurement should eventually connect visibility with business outcomes.
How to Evaluate Content ROI
Suppose two guides perform differently.
Guide A
50,000 sessions
20 leads
Guide B
10,000 sessions
200 leads
Guide A wins the traffic contest.
Guide B wins the lead-generation contest.
But perhaps Guide A earns backlinks and introduces thousands of users who later convert elsewhere.
This is why content performance requires multiple perspectives:
- Acquisition
- Engagement
- Key events
- Assisted journeys
- Backlinks
- Brand value
- Revenue
Analytics is one part of that broader evaluation.
How Often Should You Check Google Analytics?
There is no universal rule.
Checking every few minutes rarely improves strategy.
A useful cadence might be:
Real-time: implementation and campaign troubleshooting
Daily: major anomalies or high-spend campaigns
Weekly: operational performance
Monthly: marketing analysis
Quarterly: strategic analysis
The objective is not to look at analytics more frequently.
It is to make better decisions.
Frequently Asked Questions About Google Analytics
Is Google Analytics Free?
Google provides a standard Google Analytics offering as well as the enterprise-oriented Google Analytics 360 product.
The standard product is sufficient for many websites and businesses.
What Is GA4?
GA4 stands for Google Analytics 4, the current generation of Google Analytics.
It uses an event-based measurement model.
Is Universal Analytics Still the Current Version?
No.
GA4 is the current Google Analytics platform.
Businesses should base new analytics implementations and training on GA4 rather than outdated Universal Analytics workflows.
What Is an Event?
An event records an interaction or occurrence.
Examples can include page views, clicks, purchases, and other measured actions.
What Is a Key Event?
A key event is an event that measures an action particularly important to the success of a business.
Is a Key Event the Same as a Google Ads Conversion?
Not exactly.
A GA4 key event can be used to create a conversion in Google Ads where appropriate.
What Is the Difference Between Users and Sessions?
A user represents a measured user identity.
A session represents a period of interaction.
One user can generate multiple sessions.
Does Google Analytics Show SEO Keywords?
GA4 is not the primary source for detailed Google organic search-query performance.
Use Google Search Console for Google Search queries, impressions, clicks, CTR, and position.
Should I Use Google Analytics or Search Console?
Use both.
They solve different measurement problems.
Can GA4 Track Sales?
Yes, when e-commerce measurement is implemented correctly.
Can Google Analytics Track Profit?
Not automatically in the complete accounting sense.
Revenue can be measured, while full profitability generally requires additional cost and business data.
Why Does GA4 Not Match Google Ads?
Differences can result from attribution methods, timing, identity, conversion configuration, modeling, and other methodological factors.
Why Does GA4 Not Match Search Console?
The systems measure different stages of the user journey and use different methodologies.
Exact equality should not be expected.
How Long Does GA4 Retain Data?
For standard properties, Google’s current user/event-level retention options are 2 or 14 months. Certain Analytics 360 configurations provide longer options.
Can GA4 Export Data to BigQuery?
Yes.
Google Analytics properties can export raw event data to BigQuery for advanced analysis.
Does BigQuery Data Always Match GA4 Reports?
No.
Differences can occur because the GA4 interface and raw BigQuery export use different processing and reporting methodologies.
Is Google Analytics 100% Accurate?
No analytics platform should be treated as a perfect record of every human interaction.
Privacy choices, browser behaviour, device changes, consent, tracking configuration, technical failures, modeling, and other factors can affect measurement.
The goal is not imaginary perfection.
The goal is reliable enough measurement to support better decisions.
Google Analytics Best-Practice Checklist
Before considering an analytics implementation mature, verify the following:
- GA4 is installed correctly.
- Duplicate tracking is not occurring.
- Website and app streams are configured appropriately.
- Important events are defined.
- Key events represent genuine business outcomes.
- Event parameters provide useful context.
- E-commerce tracking is accurate where applicable.
- UTM naming standards exist.
- Internal traffic has been considered.
- Referral traffic is reviewed.
- Cross-domain tracking is configured where necessary.
- Data retention settings have been reviewed.
- Google Ads is linked where relevant.
- Search Console is connected where relevant.
- BigQuery is considered for advanced analysis.
- Privacy and consent requirements are addressed.
- Reports focus on meaningful business outcomes.
- Tracking is periodically audited.
A Better Way to Think About Analytics
The biggest mistake businesses can make is assuming that collecting more data automatically creates more knowledge.
It does not.
Consider this sequence:
Data → Information → Insight → Decision → Action → Result
Google Analytics primarily helps with the first three.
Humans still need to make the decisions.
For example:
Data
Mobile conversion rate fell from 4% to 1%.
Information
The decline started immediately after a website redesign.
Insight
The new mobile checkout may have introduced friction.
Decision
Investigate the mobile checkout experience.
Action
Fix the checkout problem.
Result
Conversion rate improves.
That is what useful analytics looks like.
The goal is not a beautiful dashboard.
The goal is:
Better decisions.
The Future of Google Analytics
Digital analytics is moving toward a world shaped by:
- Increased privacy expectations
- Reduced direct observability
- Consent-based measurement
- First-party data
- Statistical modeling
- Cross-platform customer journeys
- AI-assisted analysis
- Data warehousing
- Server-side measurement
- Integration between analytics and business systems
Google already uses modeling in areas where key events cannot always be observed directly.
At the same time, BigQuery provides businesses with access to raw event data for deeper analysis and integration with other systems.
This means the future of analytics is unlikely to be:
“Track absolutely everything about everyone.”
A more sustainable model is:
Collect necessary data responsibly, integrate high-quality first-party business information, use modeling appropriately, and extract better insights from fewer but more meaningful signals.
Final Verdict
Google Analytics is much more than a website visitor counter.
Used correctly, GA4 can become a central component of a business’s digital measurement system.
It can help organisations understand:
Who arrives → Where they came from → What they do → What matters → What creates value
But simply installing Google Analytics creates almost no competitive advantage.
The real value comes from designing measurement around meaningful business questions.
A weak analytics strategy asks:
“How many visitors did we get?”
A stronger strategy asks:
“Which channels generated engaged visitors?”
A better strategy asks:
“Which channels generated key events?”
A mature business asks:
“Which acquisition channels, landing pages, campaigns, and customer journeys generated profitable long-term customers?”
That progression represents the difference between website statistics and business intelligence.
Businesses should therefore avoid measuring success solely through:
Users → Sessions → Pageviews
Instead, connect measurement progressively toward:
Users → Engagement → Key Events → Qualified Leads/Purchases → Customers → Revenue → Profit → Lifetime Value
Google Analytics becomes particularly powerful when combined with:
- Google Search Console
- Google Ads
- CRM systems
- E-commerce platforms
- Search engine optimisation
- Content marketing
- Conversion rate optimisation
- Customer research
- BigQuery
- Business intelligence systems
No analytics tool can replace strategy.
No dashboard can understand a business better than the people responsible for it.
And no amount of tracking can compensate for unclear objectives.
The most valuable analytics implementation is therefore not necessarily the one collecting the greatest number of events.
It is the one that most reliably answers:
What happened?
Why might it have happened?
What should we do next?
That is the real purpose of Google Analytics.
Authoritative Sources and Further Reading
For current implementation details, use Google’s official documentation because GA4 functionality, terminology, limits, and privacy features continue to evolve.
Authoritative Sources and Further Reading
Google Analytics features, terminology, reporting capabilities, privacy controls, integrations, and implementation requirements continue to evolve. For the latest information and technical guidance, readers should consult Google’s official documentation.
Official Google Analytics Help Center
https://support.google.com/analytics/
Google Analytics — Key Events Documentation
https://support.google.com/analytics/answer/9267568
Google Analytics — Data Retention Documentation
https://support.google.com/analytics/answer/7667196
Google Analytics — BigQuery Export Documentation
https://support.google.com/analytics/answer/9358801
Google Developers — BigQuery Export for Google Analytics
https://developers.google.com/analytics/bigquery/
Discover more from My Advisers
Subscribe to get the latest posts sent to your email.